As we reach the conclusion of the international break, it’s an opportune moment to evaluate the early expected goals (xG) data from the 2026/27 Fantasy Premier League season. The analysis will cover both team performances and individual player contributions to gain insight into their effectiveness in attack and defense. Fantasy Premier League managers rely heavily on data, and the xG metric has gained traction as an essential tool for assessing how well teams are translating chances into goals on the pitch.
Team Performance Insights
Expected Goals (xG) Analysis
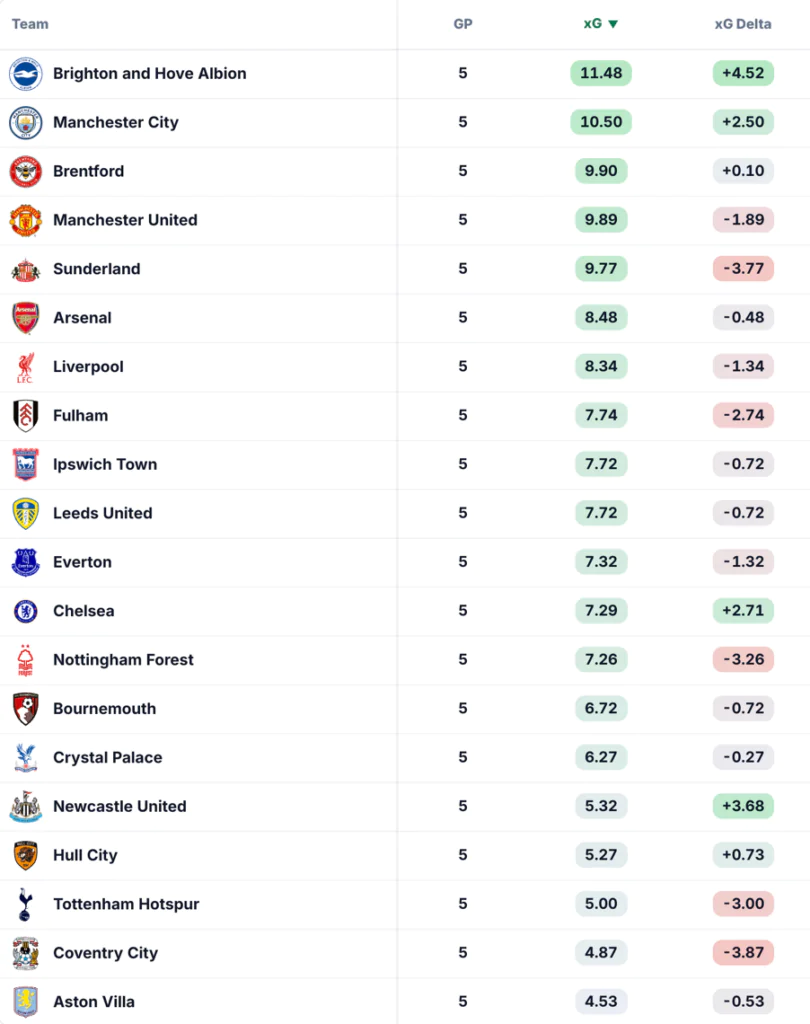
Brighton and Hove Albion has emerged as the most potent attacking force so far, generating an impressive 11.48 xG over the first five Gameweeks. They've scored 15 goals, translating to a +4.52 xG delta, indicating their efficiency in converting chances. It’s not just a lucky streak; Brighton's attacking philosophy under their current management emphasizes high-tempo play and versatile positioning, which often leaves defenders scrambling to keep up. Although their statistics are partly bolstered by facing teams reduced to ten players in some matches, their thrilling play merits acknowledgment and suggests a team capable of fine-tuning performances throughout the season.
Following Brighton are Manchester City and Brentford. City has spent the most time in the lead this season, hinting that their potential xG outcomes could be even higher had they needed to assert a more aggressive approach. It raises the question of how they might perform when facing stronger opposition. For Manchester United, their ranking at fourth is a bit deceptive. Despite boasting 112 shots, the most in the league, their xG per shot stands at just 0.09—the second lowest. This starkly raises questions about the quality of their chances, suggesting that while the team is creating opportunities, they're not of the caliber likely to result in goals. If you’re working in this space, these metrics could provide some troubling insight into why United is struggling despite their shot volume.
On the lower end, Sunderland struggles significantly with only six goals from an xG of 9.77. Their performance has been severely impacted by missed opportunities, including a recent failed penalty against Arsenal. This chronic underperformance ranks them among the worst in the league—second only to Coventry City. In such cases, the reliance on basic xG metrics might obscure deeper issues, like team morale or tactical inefficiencies, which could contribute to a lack of finishing ability.
| Gameweek | Opponent | Goals Scored | xG |
|---|---|---|---|
| 1 | Liverpool (h) | 2 | 1.58 |
| 2 | Spurs (a) | 2 | 0.72 |
| 3 | Bournemouth (h) | 2 | 0.71 |
| 4 | Leeds (a) | 1 | 0.88 |
| 5 | Hull (h) | 2 | 1.44 |
Newcastle United stands out for its remarkable efficiency. Despite having the fifth-lowest xG at 5.32, they’ve netted nine goals, demonstrating the ability to capitalize on key opportunities effectively. This tendency to score from limited chances showcases the importance of clinical finishing in football, often where matches are won or lost. Teams like Tottenham Hotspur and Nottingham Forest find themselves in a somewhat opposite situation. Each has lagged in goal conversion relative to their xG, failing to score at least three goals compared to what their xG would suggest. This discrepancy could imply either a lack of confidence in front of goal or just simple misfortune, but one thing's clear: the gap between chance creation and goal scoring could become a critical narrative as the season unfolds.
Expected Goals Conceded (xGC)
While the attacking stats dominate the conversation, defensive metrics such as expected goals conceded (xGC) will provide further depth to performance assessments as the season progresses. Understanding xGC helps managers gauge not only how effective a defense is but also how they deal with pressure and how often they allow high-quality chances against them. However, details on this will be reserved for members, promising an in-depth view of team defenses. What this means for you as a manager is that a team's xGC could be just as telling as their xG, giving insight into potential clean sheets and defensive weaknesses in upcoming matches.
Implications and Future Outlook
The early xG data might be just a snapshot of the season, but it has significant implications for Fantasy Premier League managers. Managers must consider not only current performances but also the underlying metrics that could forecast future success. For some teams, such as Brighton and Newcastle, the current metrics suggest continued performances that could yield valuable points. For others like Sunderland and Manchester United, trends suggest adjustment is crucial. This is more significant than it looks; strategic transfers and captain choices based on consistent xG over time could make or break a Fantasy season.
The dynamics of the Premier League can shift quickly, and teams' attacking and defensive capabilities often fluctuate based on forms, injuries, and tactical adjustments. In this environment, staying attuned to these statistics can provide a competitive edge and help anticipate which players are worth bringing into your squad.
As the early season drama unfolds, Fantasy Premier League managers should keep a close watch on these dynamics, evaluating not just the outcomes, but the underlying metrics that could hint at future performance as the campaign continues.